Central monitoring with Uptime Kuma
MILOUD NECILI
Fraîche Flow · IT Systems Integration
Project objective
Monitor the lab infrastructure centrally and provision monitors automatically rather than individually through the interface.
My implementation
- Ran Uptime Kuma 2.5.8 with a separate MariaDB in the Compose project.
- Used AutoKuma 2.0.0 with Docker labels for automatic monitor creation.
- Set up HTTP, TCP port and ping checks for 15 endpoints.
- Isolated Socket.IO, database and reachability failures using logs and heartbeats.
Technical context
| Containers | uptime-kuma, kuma-db, autokuma |
|---|---|
| Project | ~/docker/uptime-kuma |
| Access | Termius: local 13001 → internal 3001 |
| Final view | 15 online · 0 offline · 0 unknown |
Result
The attached final view shows 15 online monitors and 0 offline. Five consecutive heartbeats for System MariaDB showed status=1. Some historical availability figures remained below 100 percent.
Verification and operational evidence
docker ps --filter name=uptime-kuma --filter name=kuma-db --filter name=autokuma
docker logs --tail 40 autokuma
curl --max-time 10 -sS "http://127.0.0.1:3001/socket.io/?EIO=4&transport=polling"
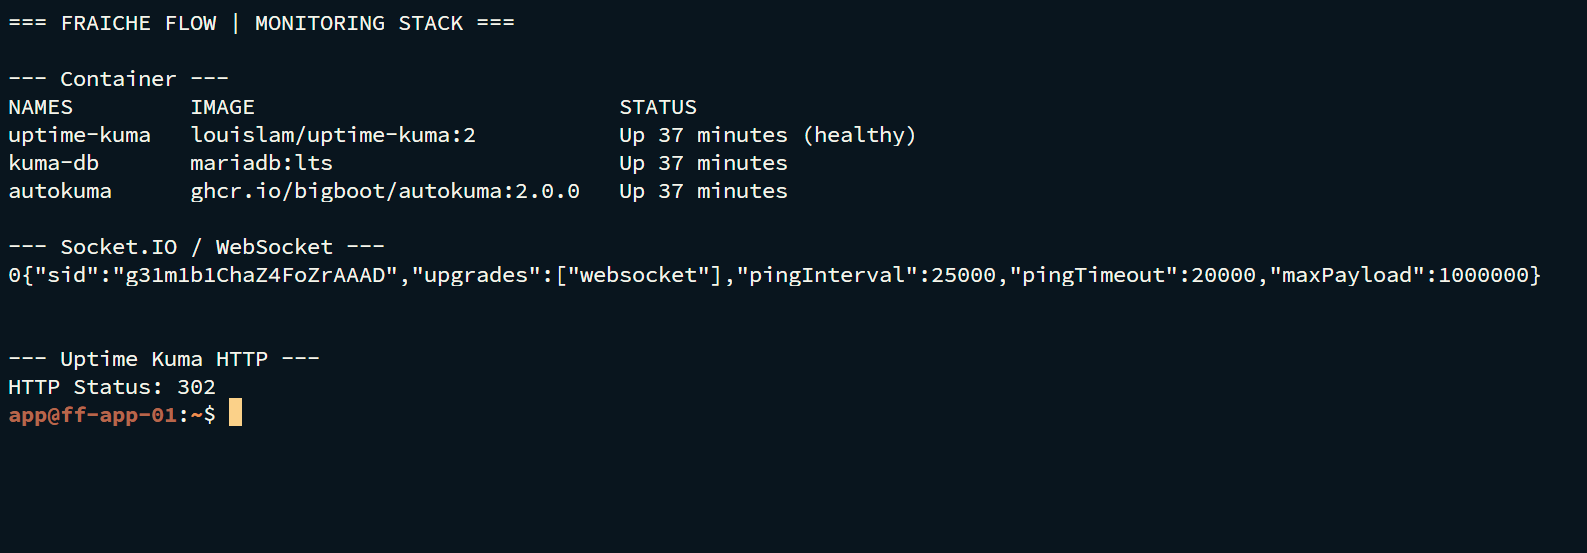
Practical troubleshooting
YAML indentation, initial EngineIO connection errors and Socket.IO interruptions were investigated. ER_DUP_ENTRY occurred in stat_daily and stat_hourly; a lasting fix for this statistics problem is not evidenced.
Security and technical context
TCP checks on 443 and 9443 validate neither TLS certificates nor login. Ping to DNS and Chrony does not test their respective protocols. The Docker socket and admin access require particular protection.
Transferable skills
Observability, declarative monitor provisioning, log correlation and availability interpretation.
Final evidence: monitoring
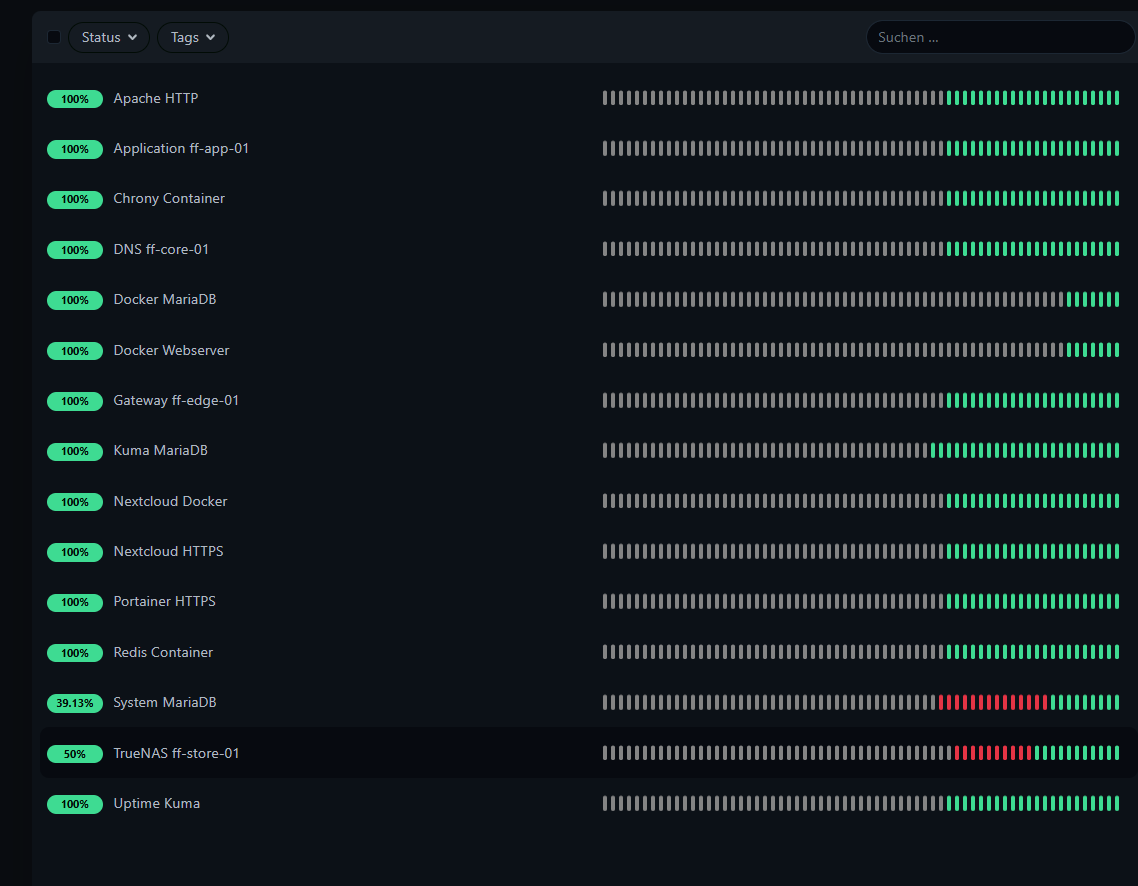
The history shows 39.13% for System MariaDB and 50% for TrueNAS. Current reachability is green; this does not imply continuous historical availability of 100%.
Monitored endpoints
- HTTP: Uptime Kuma, Nextcloud Docker, Docker Webserver.
- TCP port: Apache HTTP, Nextcloud HTTPS, Portainer HTTPS, System MariaDB, Kuma MariaDB, Docker MariaDB, Redis Container.
- Ping: Application ff-app-01, Chrony Container, DNS ff-core-01, Gateway ff-edge-01, TrueNAS ff-store-01.
Monitor labels are project names. A TCP port test on HTTPS does not replace certificate validation; a ping test on DNS or Chrony does not replace a DNS or NTP functional test.
Project status
Completed according to confirmation from the project lead.